Lecture 2
2023-03-23
MIT OCW 14.01SC L2 - Application of Supply and Demand
MIT OCW 14.01SC - Lec 2 (Youtube)
-
Supply and Demand
- Demand
Q_d = D(P)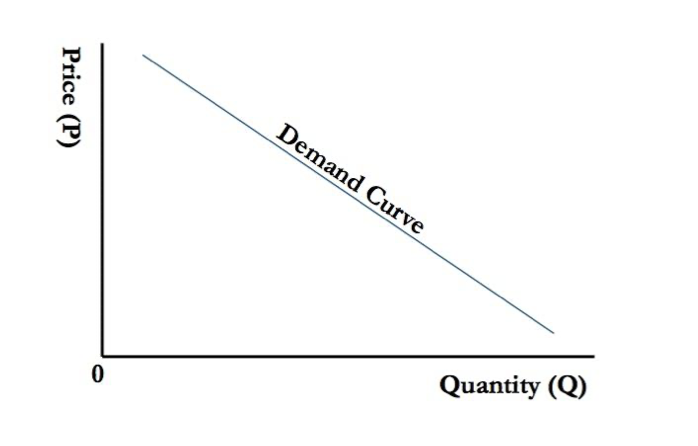
dQ_d / dP < 0- Demand curve may shift due to changes in variables other than price.
- Market demand is equal to sum of consumer demand.
Q_m = \sum Q_i
- Supply
Q_s = S(P)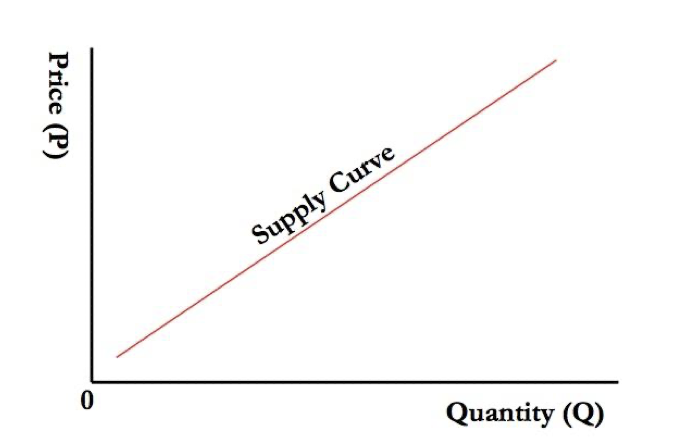
dQ_s / dP > 0- Also influenced by other variables, like input costs, technology.
- Market Equlibrium
Q_d (P*) = Q_s (P*)P*is optimal price.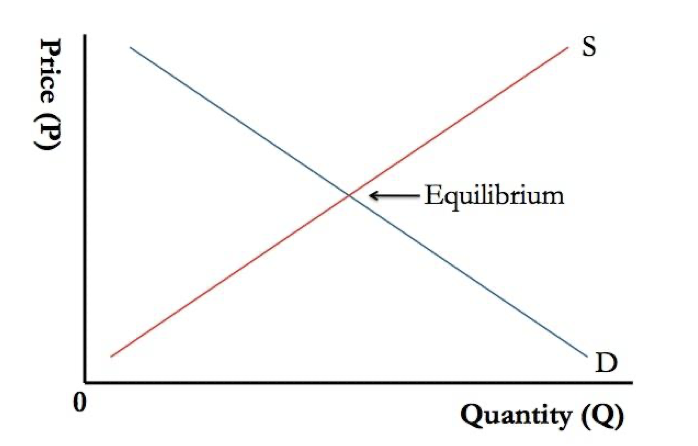
- Demand
-
Equilibrium shocks
- What happens when you change the equilibrium (through supply or demand shock)?
- Understand every concept on three levels: intuitive, graphical, mathematical.
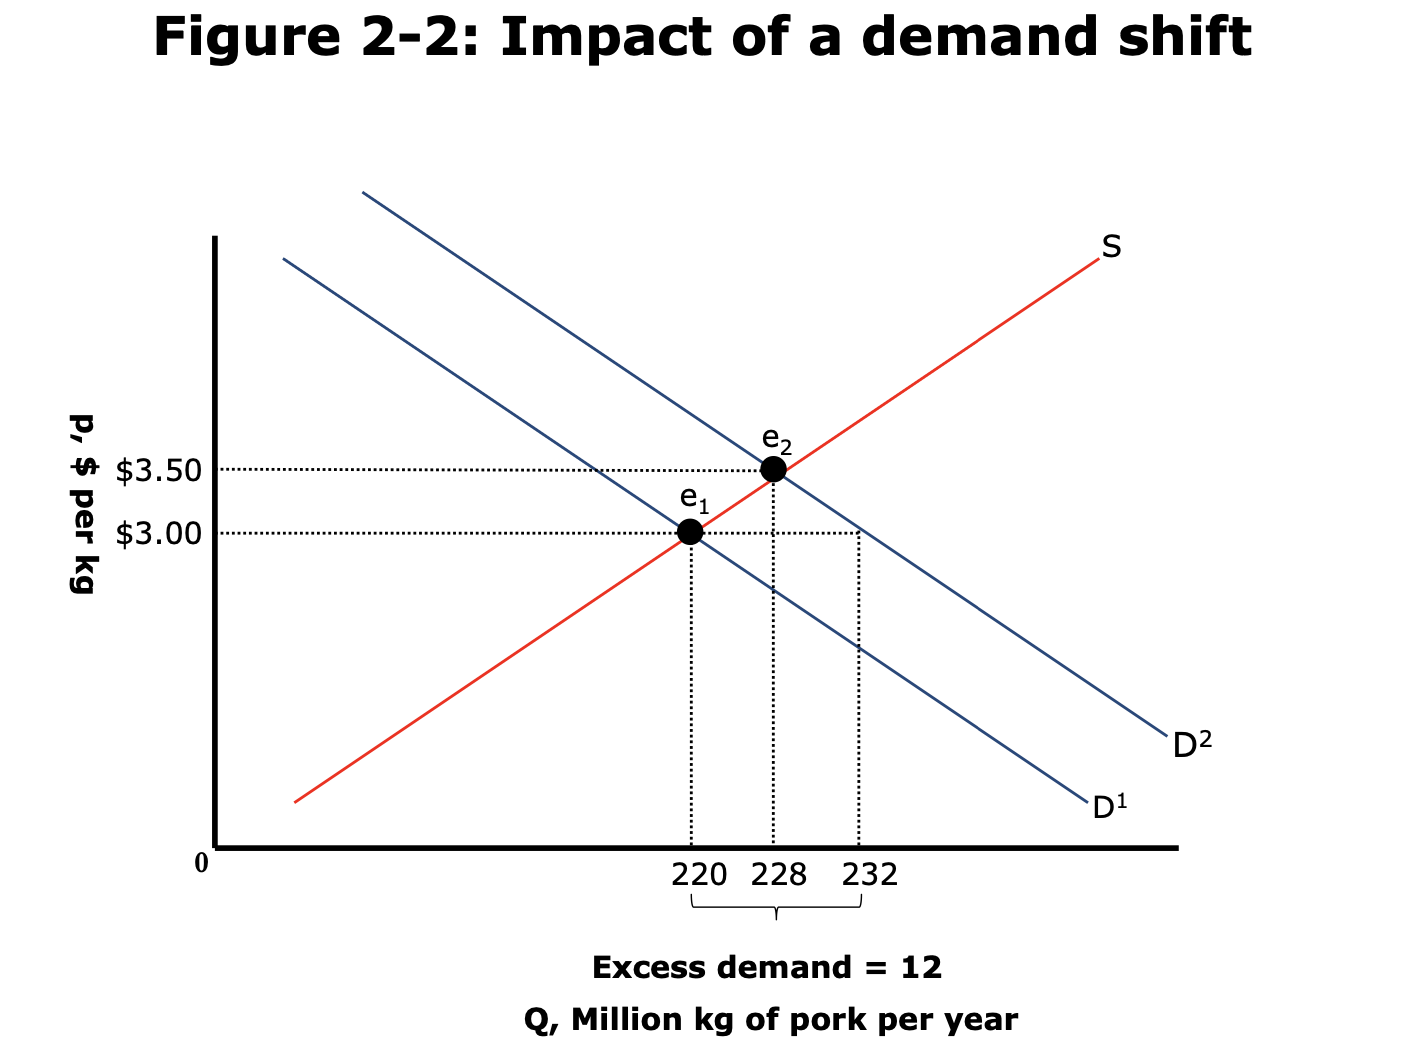
- Example 1. Price of substitute product increases, demand for good also increases. Demand curve shifts up (outward). There is new eqm.
- Initially: Excess demand.
- Slide up the supply curve to higher price at new eqm.
- General eqm: Markets may affect prices in other markets. Feedback effect where it affects the original price. (not in scope within this course).
- Where does supply curve come from? Producer theory - discussed later. (from firms trying to maximise their profits).
- Example 2. Price of producing good increases. Supply curve shifts upward (inward).
- Less ability to produce at the same price. Reduced supply.
- New eqm at higher price.
- In both situations (increased demand and decreased supply), the same thing happened! The price went up.
- From looking at the price alone it is not possible to tell which of these happened.
- However the volume was affected differently, in one the qty went up, in other qty went down.
-
Government Intervention
- Example: Minimum wage
- Consider market for Labour
- Labour is an input to the production process
- Firms demand labour, People supply labour. (flipped wrt. previous example of goods)
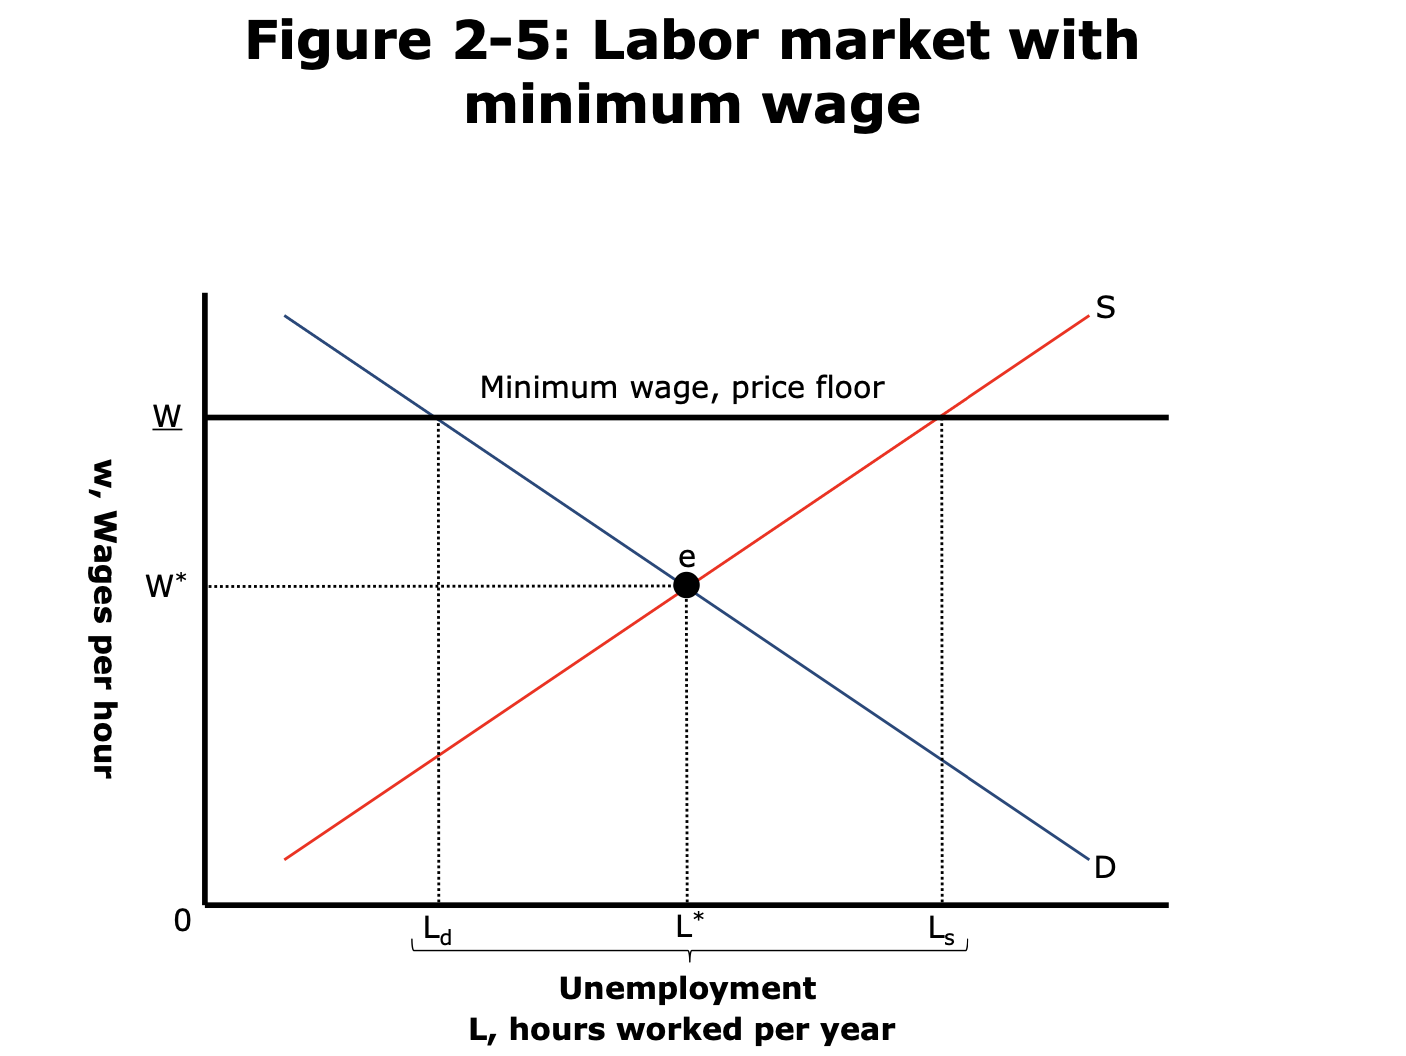
- At wage
W_(aboveW*), workers are delighted to workL_shours, but firms need onlyL_dhours.- Excess supply.
- Under perfectly competitive market conditions -> excess supply would cause demand to increase and wages would fall.
- But you can't do that now because of the govt.
- We call the excess supply 'unemployment'.
- Disequilibrium -> market condition still exists at
(L_d, W_)-> determined by constraint.
- Example 2: Gas price ceiling.
- Price capped at
p1, eqm was atp2. - Excess demand now. Eqm shifts to new point with lower qty being supplied at lower price.
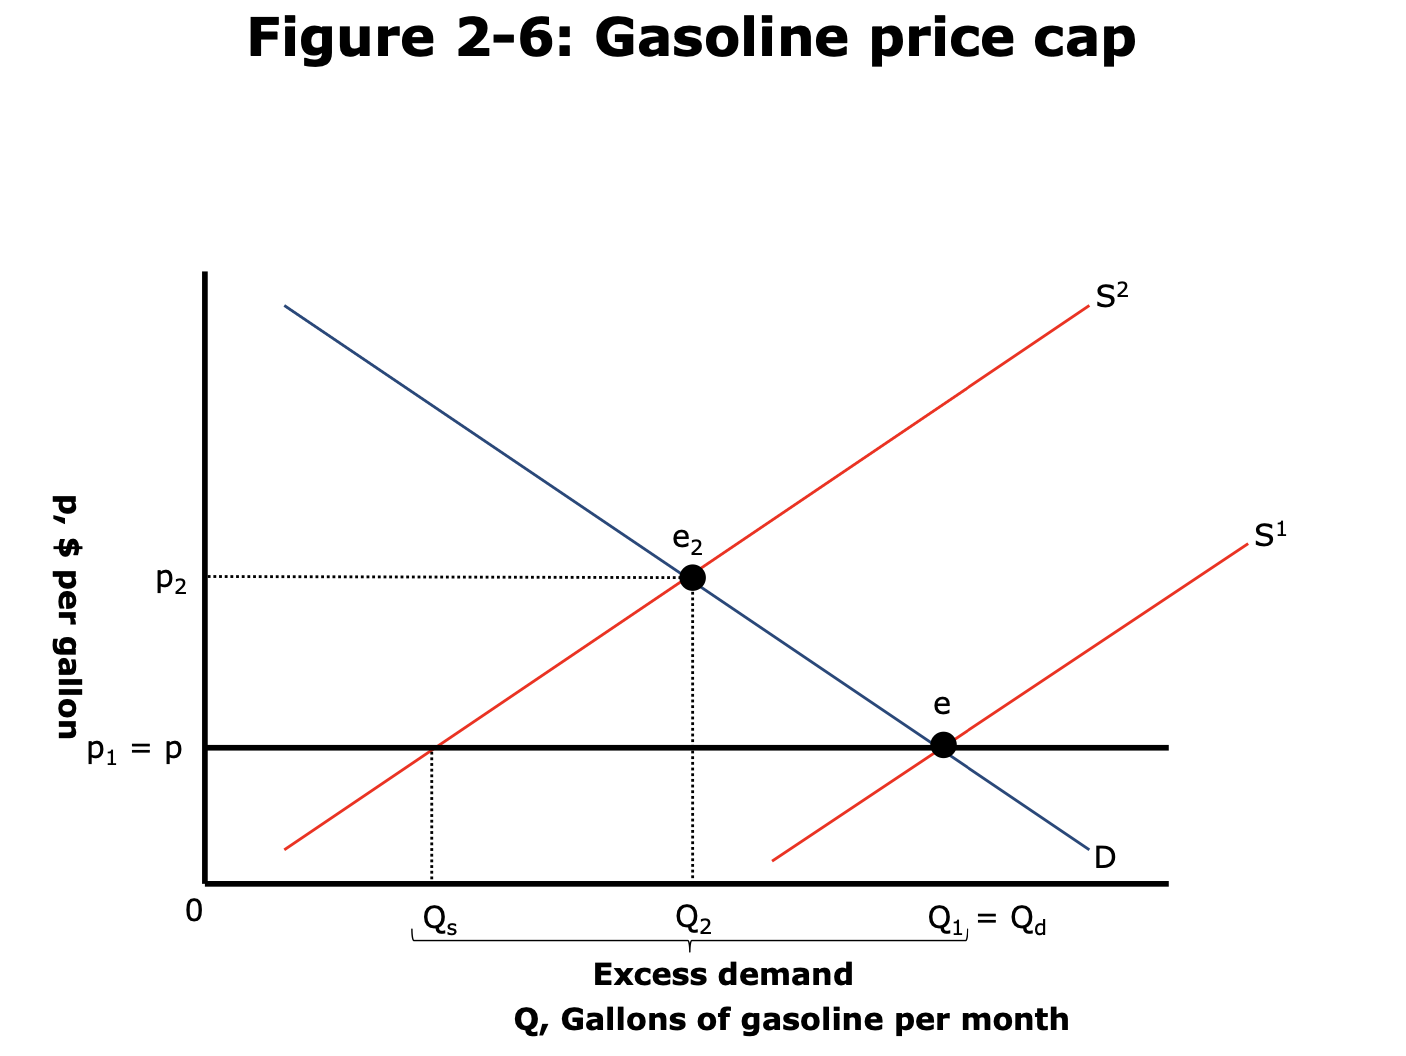
- Price capped at
- Markets are robust and will do whatever they can to restore equilibrium!
- Welfare economics of this restriction?
- Costs:
- Efficiency loss: A trade that could have made both parties better off is not made.
- Allocation inefficiency: Lines at the gas station. Gas shortage. (Hoarding?)
- Benefit:
- Equity: Fairness
- Direct effects (what voters see) and indirect effects (what economists see).
- Equity-Efficiency tradeoffs.
- Secondary markets can arise to evade government regulation.
- Costs: