Lecture 3
2023-03-23
MIT OCW 14.01SC L3 - Elasticity
MIT OCW 14.01SC - Lec 3 (Youtube)
-
What determines the size supply/demand shifts?
-
What is the shape of the supply/demand curve?
-
Consider a Supply shift
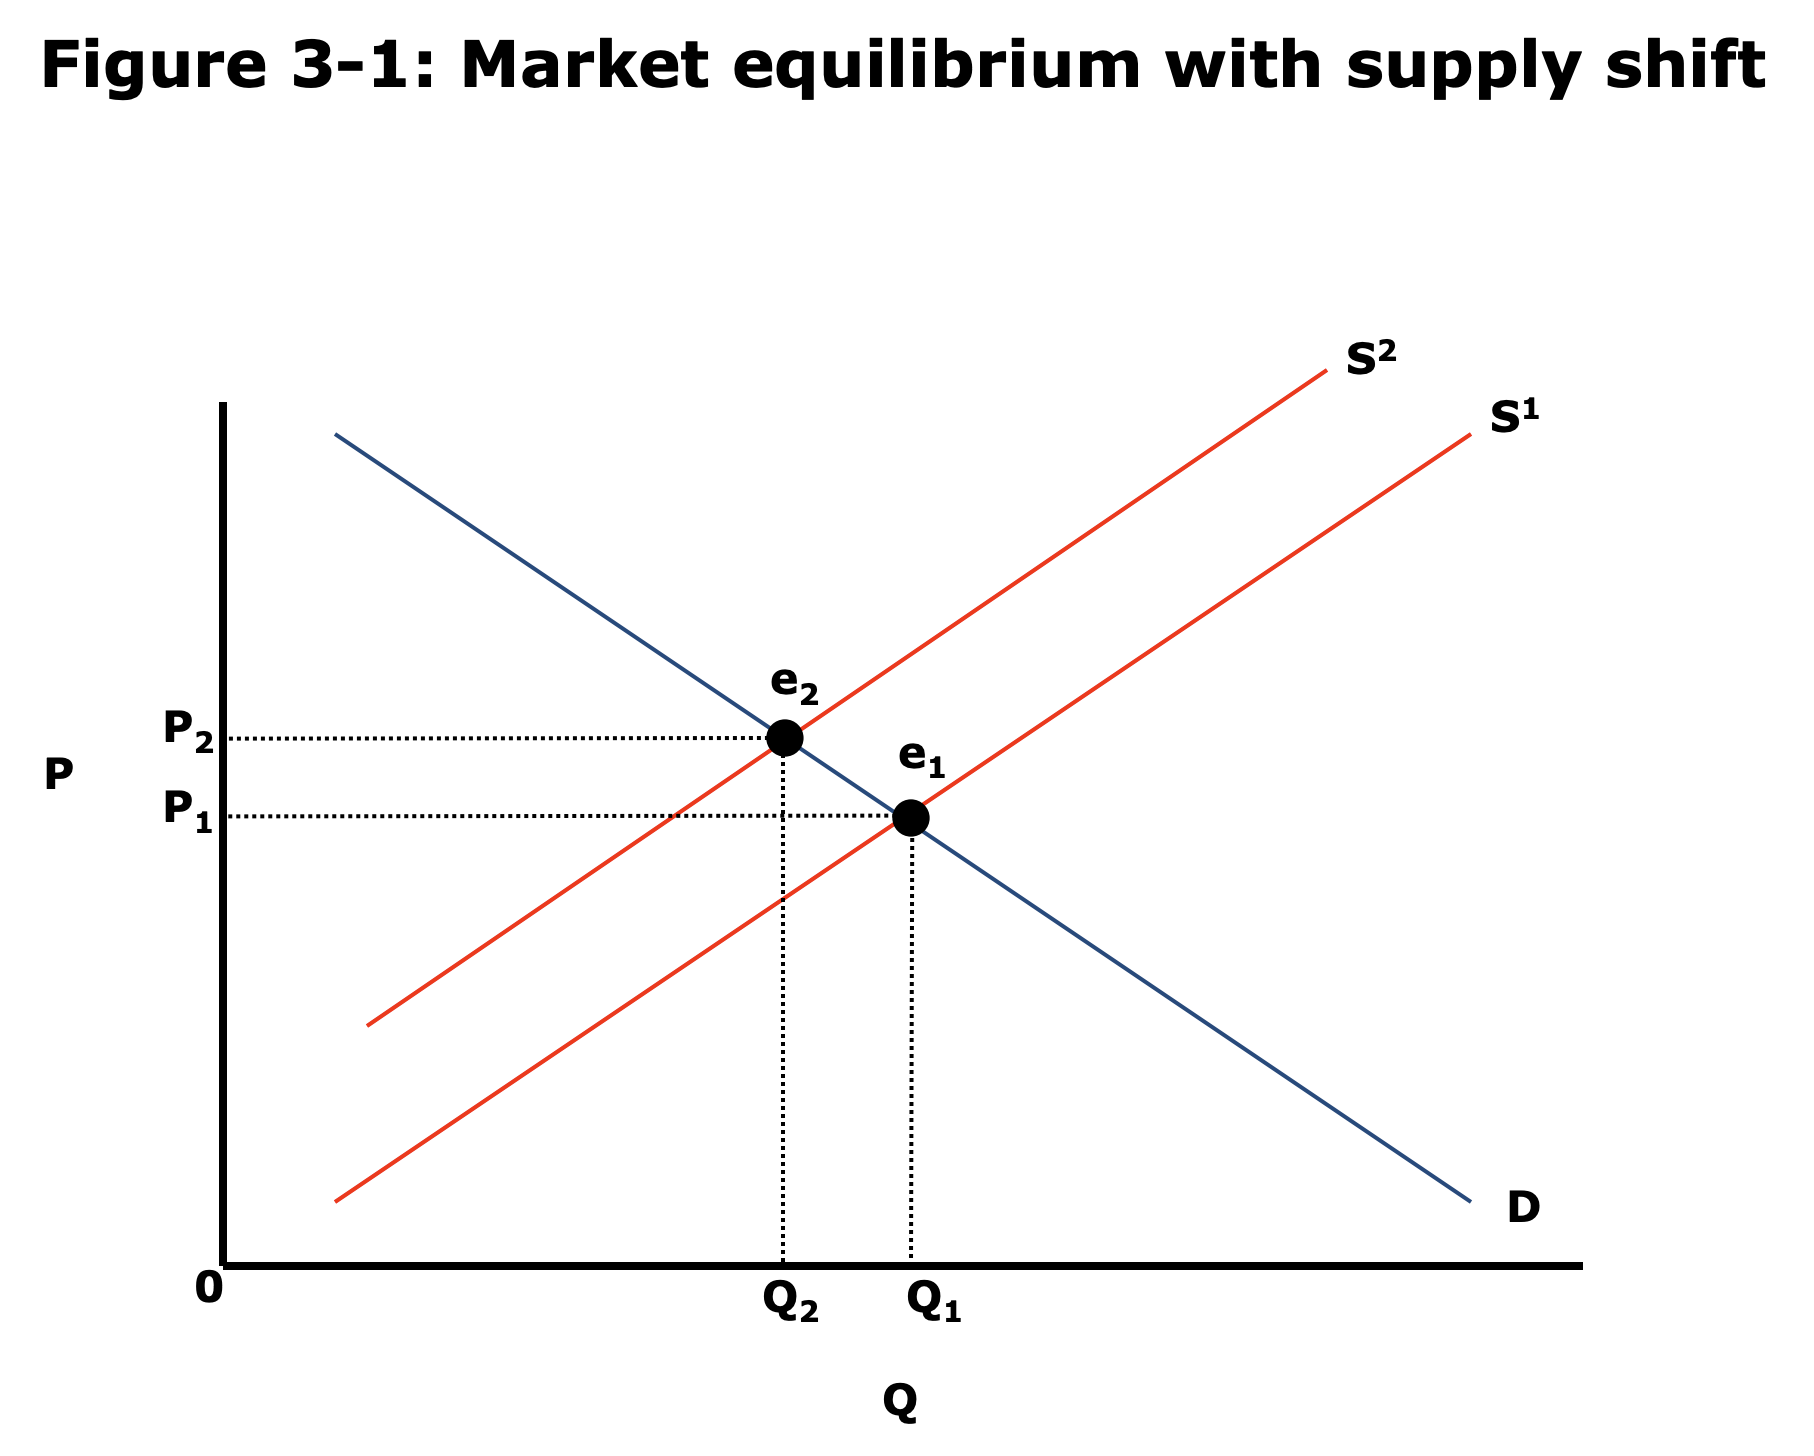
- Size of shift determined by Elasticity.
- Elasticity of demand = how senstiive is demand to a price change? = slope of demand curve
- Similarly Elasticity of supply = slope of supply curve.
- Perfectly Inelastic Demand
- Demand does not change with price change
- Straight vertical line on price-qty diagram.
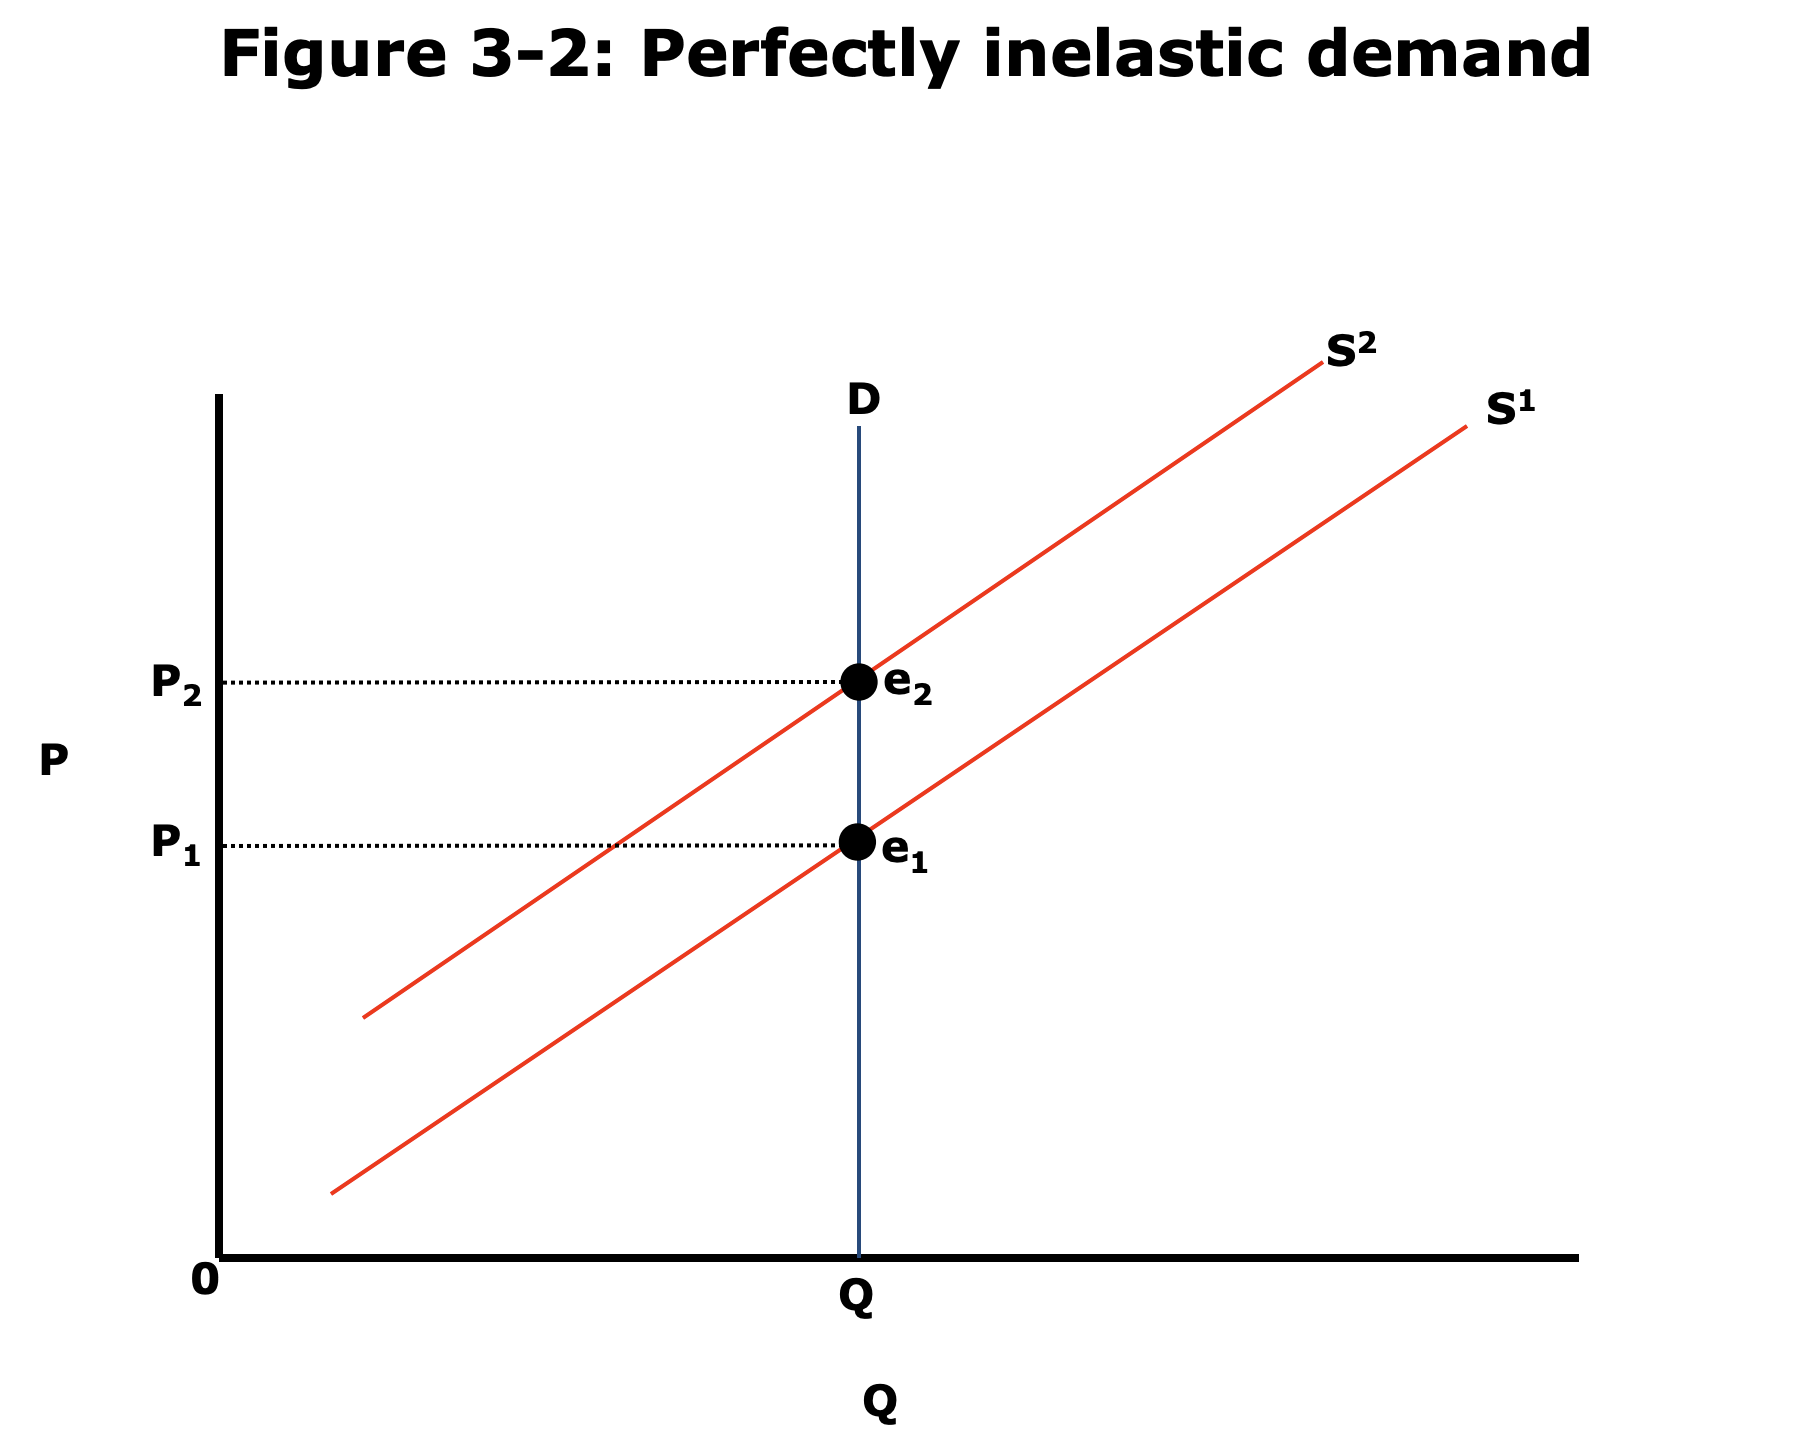
- Example: when there are no substitutes.
- Some Medicine / treatments - e.g. insulin for diabetics.
- Example of elastic demand: viagra.
- What happens in case of supply shock?
- If supply decreases(?) There cannot be excess demand. The price increases. No change in qty.
- Perfectly Elastic Demand.
- Straight horizontal line on price-qty diagram.
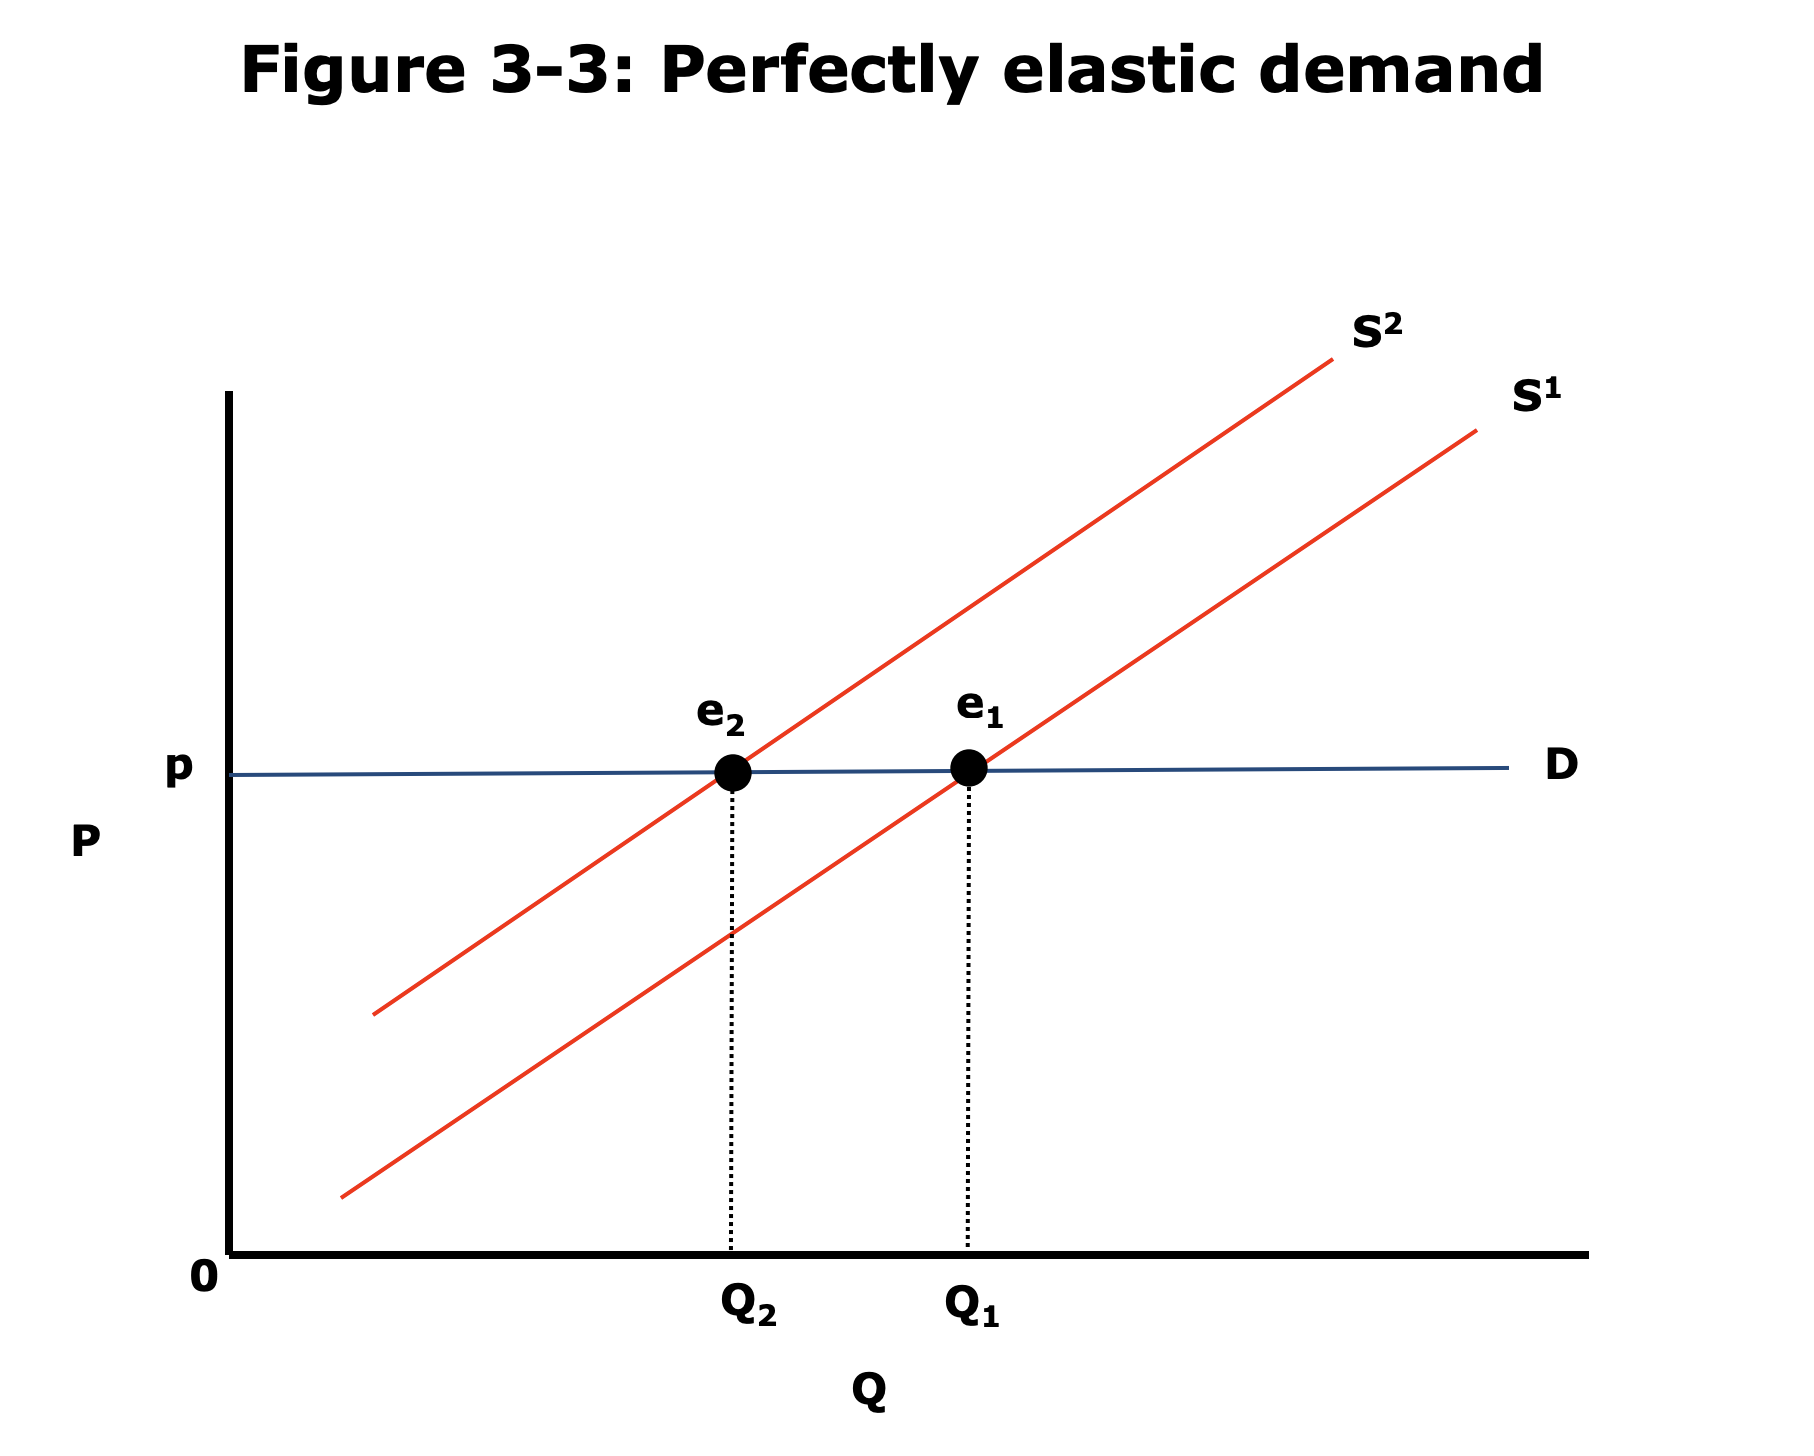
- Where consumers don't care about quantity, but only about price.
- Example: There are infinitely good substitutes.
- E.g. Candy. Orbit and Eclipse. McDonalds and Burger King.
- If price of Orbit increases people would buy Eclipse.
- If there is a supply shock, price could not change, only qty supplied would change.
- Straight horizontal line on price-qty diagram.
-
Elasiticity (\epsilon) = (dQ/Q)/(dP/P) = (dQ/dP)*(P/Q). (should be negative) (percent change in qty / percent change in price)- Perfectly Inelastic Demand:
elasticity = 0. - Perfectly Elastic Demand:
elasticity = -infinite. - (*) units: dimensionless
- (*) dimensional analysis check:
dQ/dP = (change in no of candies demanded) / (change in price per candy) = candies / ($ per candy) = candies^2 / $
P/Q = (price per candy / candies demanded in total) = $ / candies^2
- Perfectly Inelastic Demand:
-
Peek ahead about Producer theory:
- Revenue
R = Q * P(unit: $) dR/dP = d(Q*P)/dP = dQ/dP * P + Q dP/dP = E * Q + Q = Q * (1+E)(unit: $/($/candy) = candy!)(dR/R)/(dP/P) = (dR/dP) * (P/R) = Q(1+E)*P/R = (1+E)- If
Elasticity > -1, producer benefits by raising price.- Obviously,
Elasticity = -1means raising 1% price = losing 1% qty = equilibrium (ignoring 2nd order terms) - If Elasticity is more than that, that would mean raising 1% price = losing more than 1% qty = losing revenue overall => producer should lower prices!
- If Elasticity is less than that => producer should raise prices!
- But then why isn't price always 0 or infinity? coming up next lectures.
- Obviously,
- Revenue
-
How do we find elasticities?
- Main topic of Emperical Economics.
- Fundamental conundrum: Distinguishing correlation from causation.
- Example: Students who took SAT prep courses scored less on average.
- Imagine we have to estimate elasticity of demand.
- Need to make sure that it is a supply shift that is causing price and qty to shift and not demand shift.
- Need to make sure to measure the right slope.
- To measure elasticity of demand we need a supply shock that does not affect demand.
- One good example is govt intervention that affects producers but not demand. E.g. Producer tax.
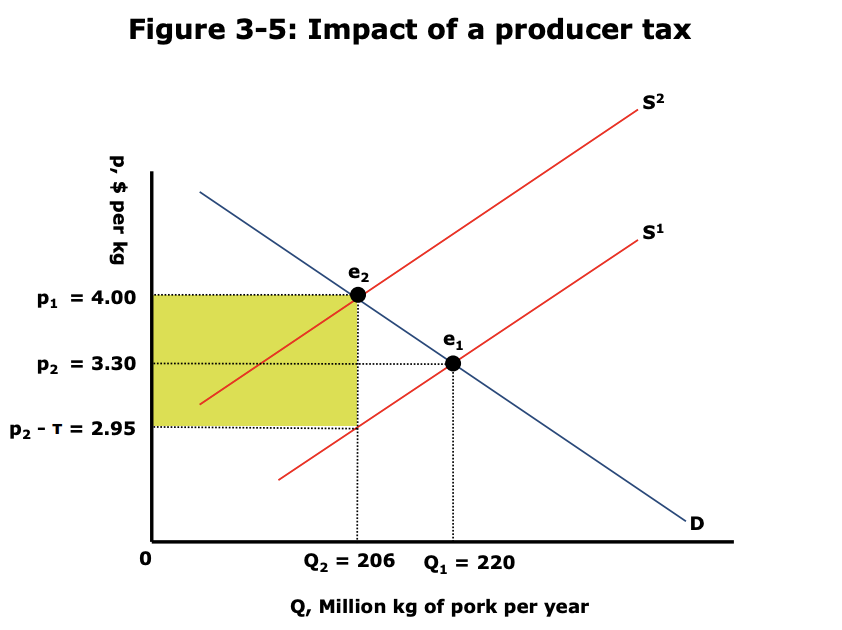
- Shaded area = amount govt raised = depends directly on elasticity of demand.
- Inelastic good = more money raised. E.g. Insulin.
- RAND experiment to find elasticity of demand of healthcare.
- Found that healthcare demand is elastic but not as much as previously thought. (Elasticity about -0.2).
- Also found that people who used less healthcare were not sicker as a result.
- It may be a good decision to have people paying for their healthcare (instead of their insurance providers).