Lecture 6
2023-04-01
MIT OCW 14.01SC L6 - Deriving Demand Curves
MIT OCW 14.01SC - Lec 6 (Youtube)
-
Food Stamps
- Indifference curves and budget line for Two individuals X & Y for food vs other goods
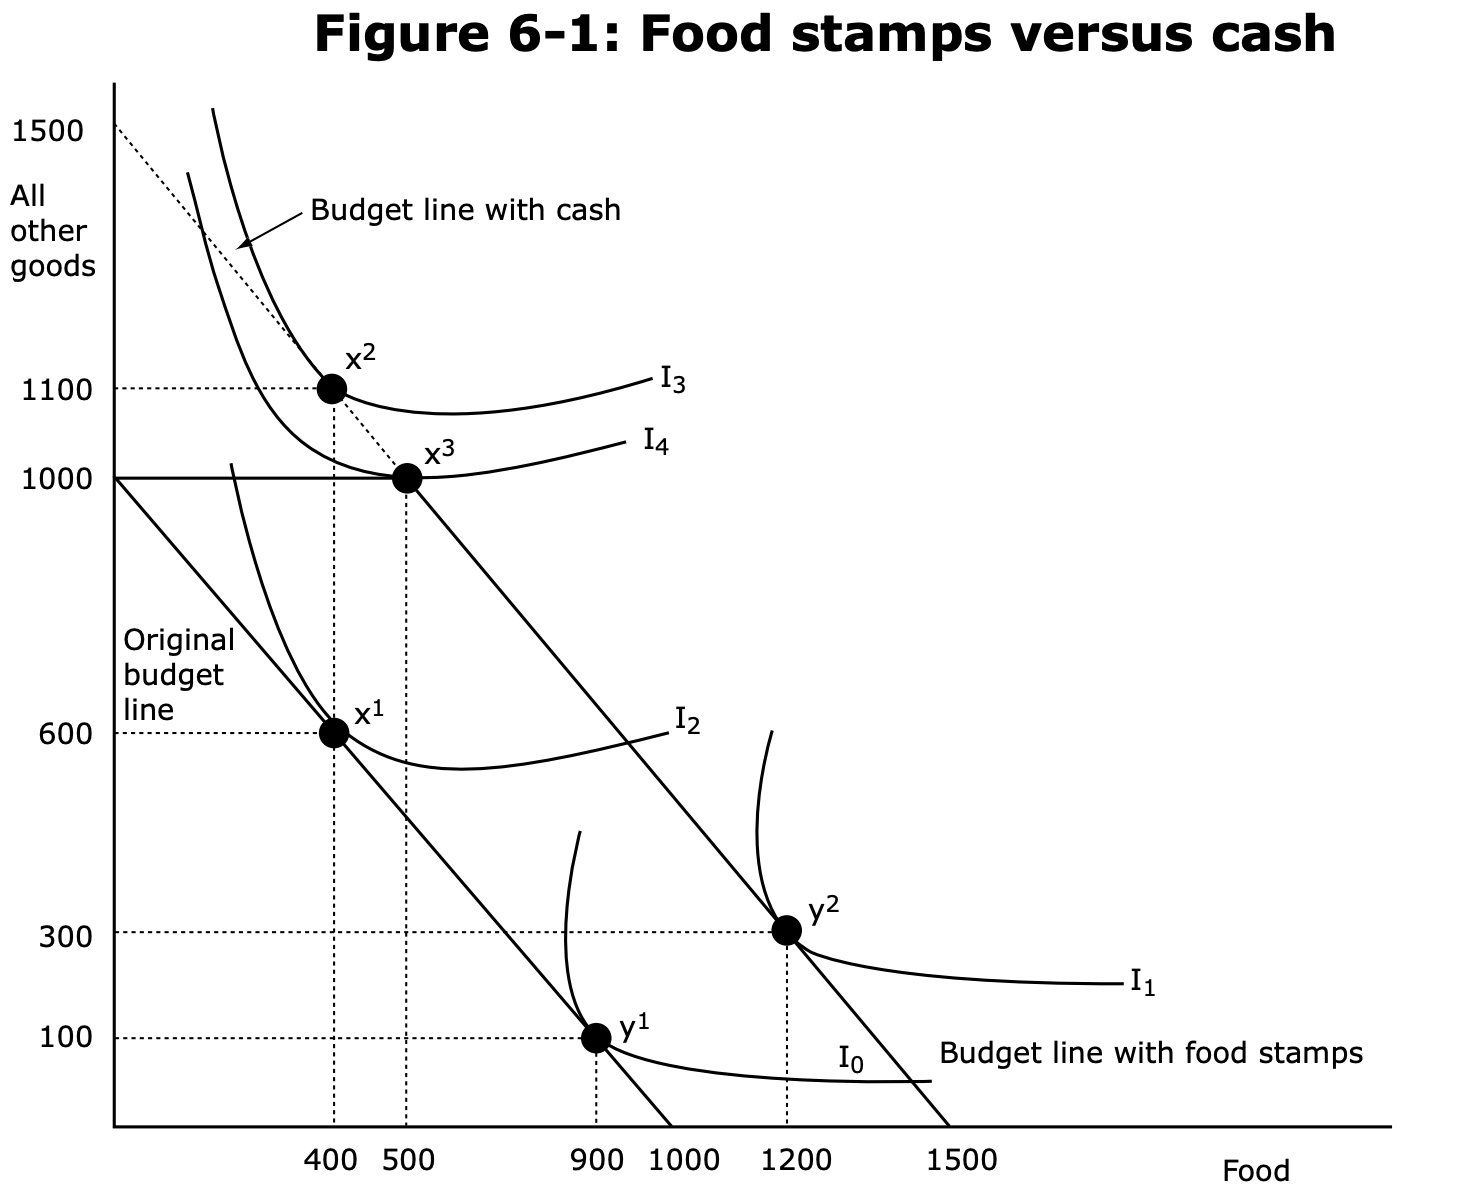
- Total income $1000 (poor people)
- Look at the Original budget line
- X cares a lot about other goods while Y cares much more about food.
- Imagine govt wants to give these people $500.
- Two ways
- Give cash
- Shifts budget constraint out
- X would choose to move from X1 to X2
- X would spend most of it on other goods and only a bit more on food. (possibly even 0?)
- Y would spend most of it on food and a bit on other goods.
- Give food stamps
- Shifts budget constraint to the right (but does not include the dotted portion of the line).
- Opportunity set is now a trapezium.
- Y would still go to Y2, but X now must go to X3. (Corner solution.)
- Give cash
- Revealed preference: X now makes a choice they'd have turned down before. Therefore it is revealed that they're worse off.
- Why give food stamps?
- $35B on food stamps in the US (Anyone below $25,000 income).
- But Why?
- Imagine 'other goods' was not labelled 'other goods' but 'Cocaine'.
- 'Paternalism': We don't trust people with the cash.
- How do we measure how much good/bad are food stamps doing?
- One idea: measure if they're buying food beyond the food stamps.
- Another idea: run an A/B experiment by giving people cash vs food stamps.
- Emperical result: 15% people are like X / people spend 15% more on food when given food stamps.
- Two ways
- Indifference curves and budget line for Two individuals X & Y for food vs other goods
-
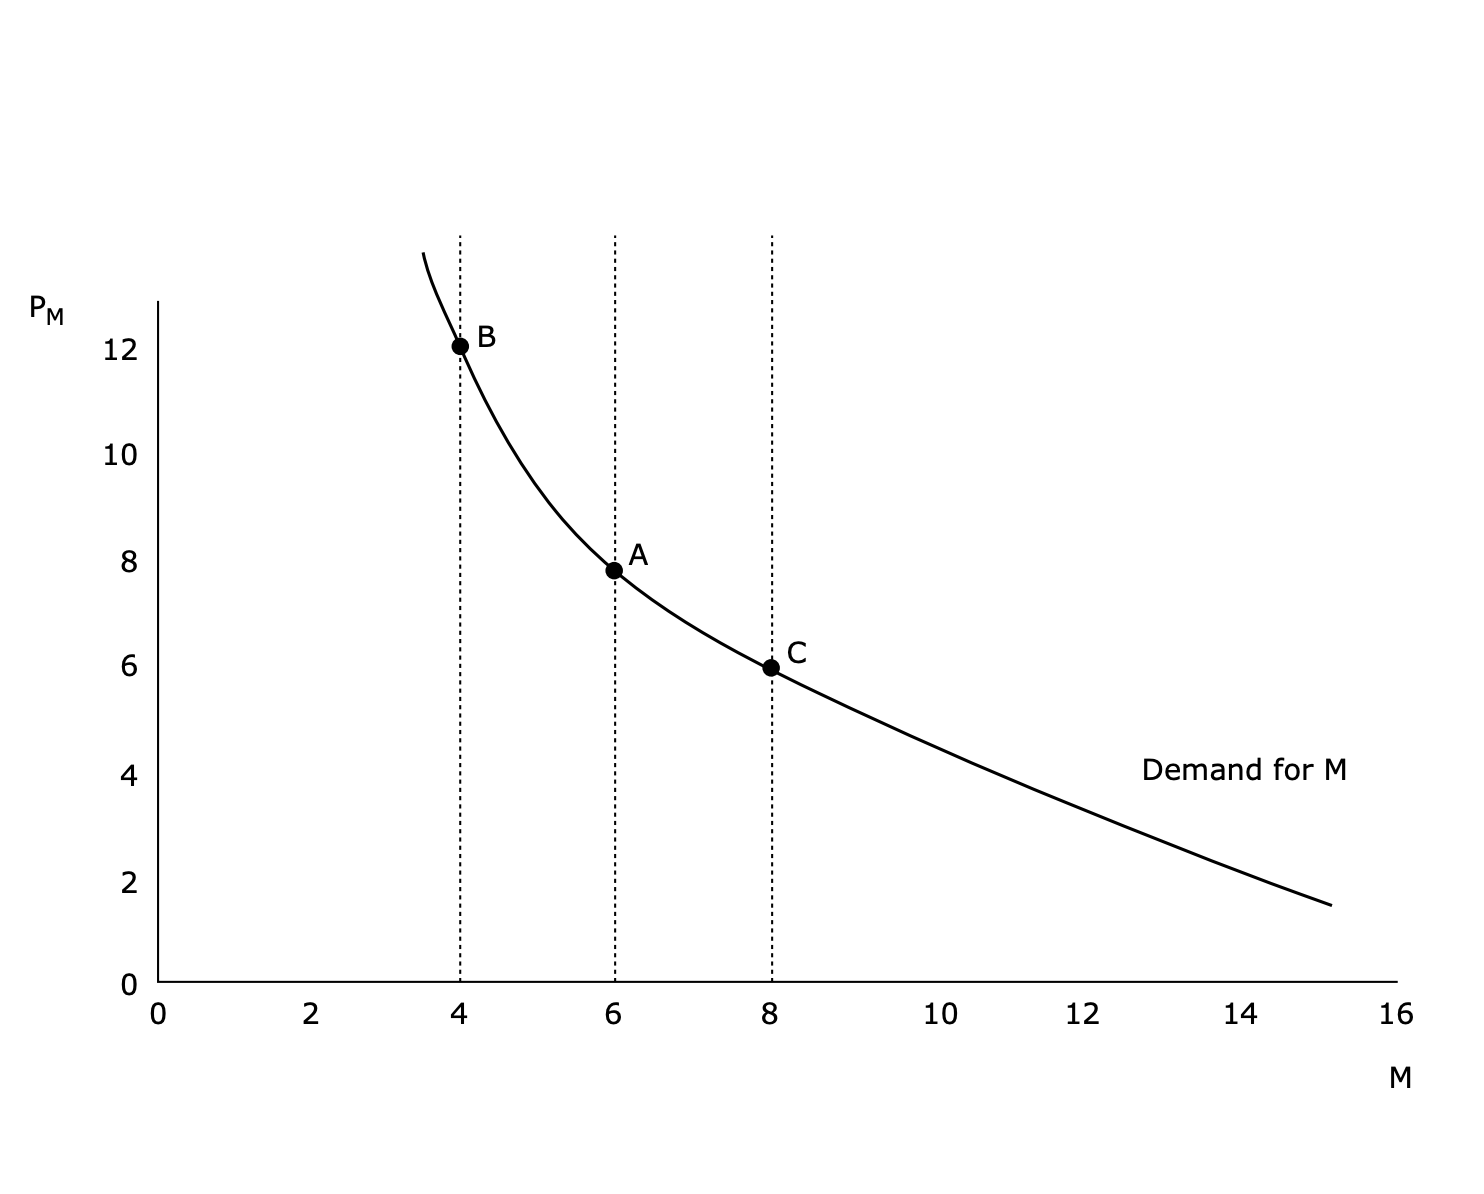
Where do demand curve come from?
- Drawing demand curve given different prices of a good and the same budget:
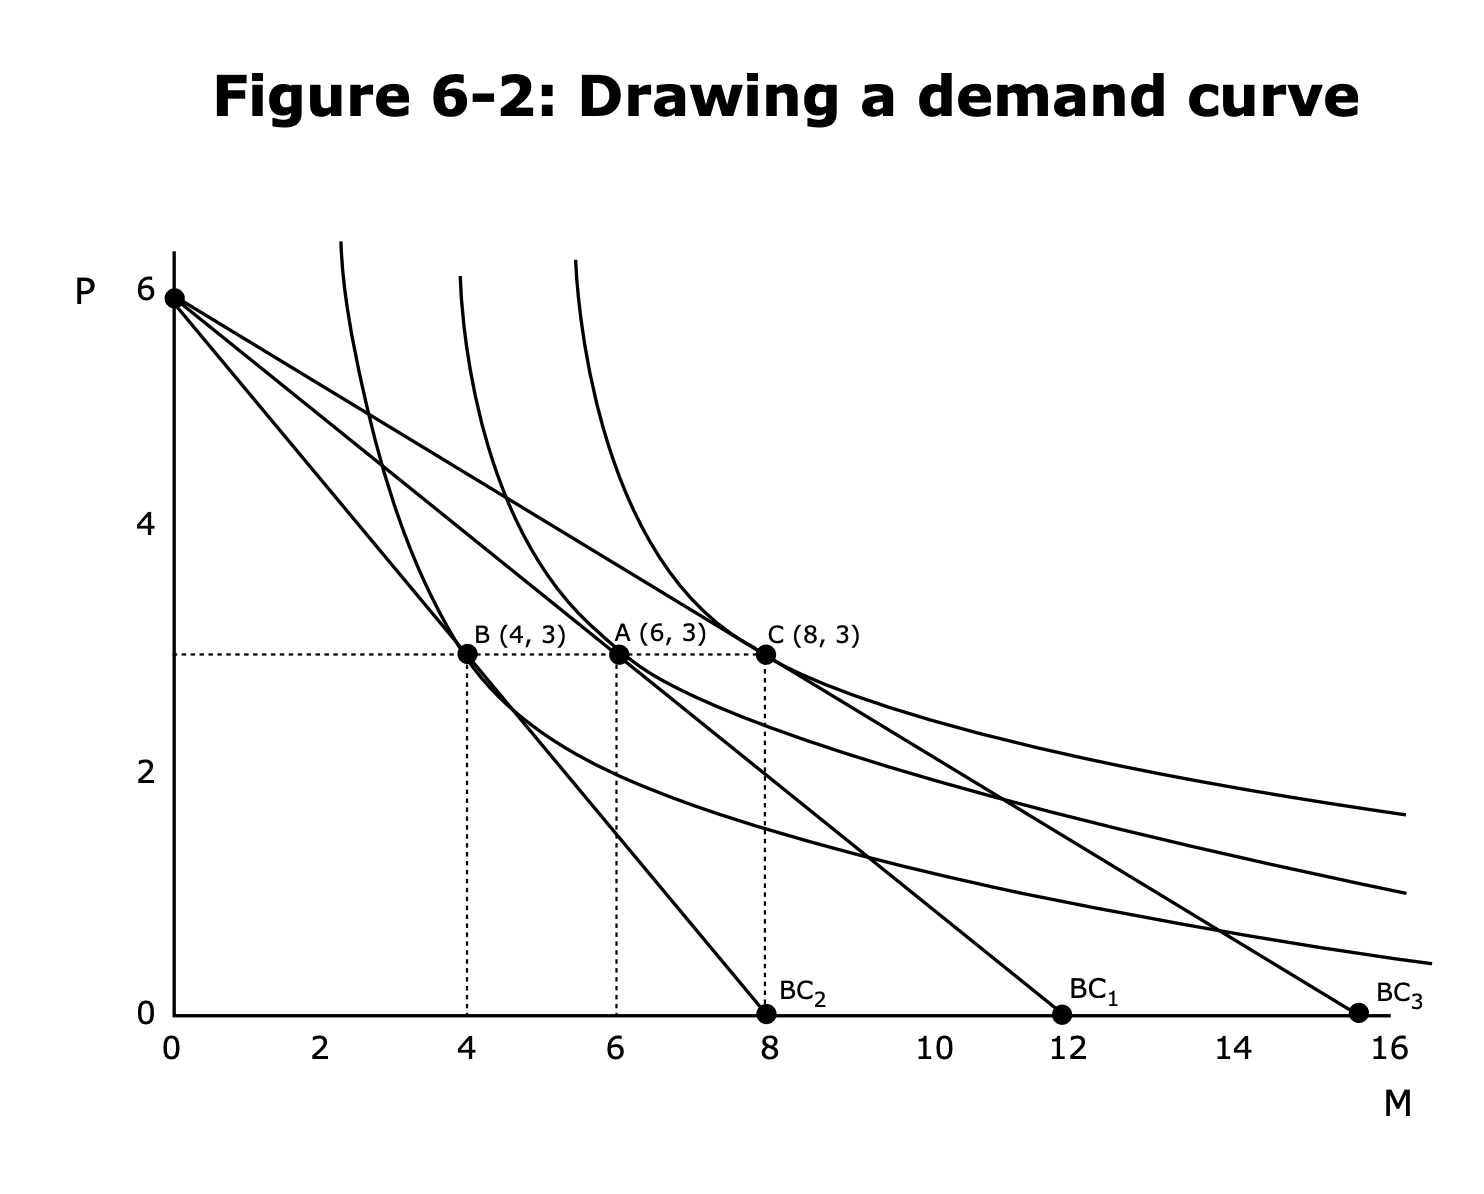
- In this particular example, price change in movies did not change demand for pizzas. This is called No cross-price elasticity.
- This will not be true in general.
- Drawing demand curve given different prices of a good and the same budget:
-
Demand curve shifting
- For example because we got richer
- We can draw different demand curves given different budget constraints.
- Engel Curve: Demand for movies changing due to changing income (at the same price of movie)
- Engels worked with Marx
- This is Engel, not Engels, different guy (lol)
- Income Elasticity of Demand - important concept
- Percentage change in quantity over percentage change in income
gamma = (dQ / Q) / (dy / y)gamma > 0for MOST goods - normal goodsgamma < 0- inferior goods- E.g. canned food or potatoes
- within normal goods
gamma < 1- Necessitiesgamma > 1- Luxuries- harder to determine (as compared to normal vs inferior) as it could depend on person
-
Where does (price) elasticity (of demand) come from?
- Demand = MAX(Utility function) (given income, price of good)
- Demand = (% of good A) * (how much total goods I can buy?)
- (*) Derivative of Demand wrt Price = (how does % of good A change) + (how does total amt of goods I can buy change with price)
- (*) How does % of good A change? first order derivative (wrt money I have) is already 0 at eqm! But not wrt prices! If prices change => M.R.Transformation changes => I will have to move to another point to make it equal to marginal rate of substitution.
- (*) How does money I have affect demand? Simple -> should just be linear factor of (% of good A)
- (*)
Q_a = Y/P_a * alpha(Y/P_a) - (*)
dQ/dP = -Y/P^2 * alpha - Y/P^2 * alpha'(Y/P) - Two main factors:
- Substitution Effect
- Change in quantity demanded, when price increases, holding utility constant
[(∂Q/Q)/(∂P/P)]_{U const}- Shift away from good as good gets expensive
- The Substitution effect is Always negative!
- If price goes up, steeper budget curve, if we are on the same indifference curve (
U const) then we must move to the left.
- Income Effect
- Change in quantity demanded, with change in income, holding prices constant
[(∂Q/Q)/(∂Y/Y)]_{P const}- Sign of Income Effect depends on whether good is normal or inferior good!
- Can lead to Giffen Goods (next time) (subset of inferior goods) where demand increases with price!
- Substitution Effect